
Name: sbgnviz.js-sample-app
Owner: iVis-at-Bilkent
Description: A sample application for SBGNViz
Created: 2016-11-25 07:29:27.0
Updated: 2017-04-30 13:16:41.0
Pushed: 2017-11-30 00:38:07.0
Homepage: http://cs.bilkent.edu.tr/~ivis/SBGNViz_sample_app/
Size: 1827
Language: JavaScript
GitHub Committers
| User | Most Recent Commit | # Commits |
|---|
Other Committers
| User | Most Recent Commit | # Commits |
|---|
This is a sample application for the web based library named SBGNViz developed for visualization of process description maps in SBGN.
SBGNViz and this sample application are distributed under GNU Lesser General Public License.
A deployment of this sample application can be found here. SBGNViz works on every platform that have Javascript support including mobile devices.
Please cite the following when you use SBGNViz.js:
M. Sari, I. Bahceci, U. Dogrusoz, S.O. Sumer, B.A. Aksoy, O. Babur, E. Demir, “SBGNViz: a tool for visualization and complexity management of SBGN process description maps“, PLoS ONE, 10(6), e0128985, 2015.
In order to deploy and run a local instance of the tool, please follow the steps below:
Installation
clone https://github.com/iVis-at-Bilkent/sbgnviz.js-sample-app.git
bgnviz.js-sample-app
install
Running the tool
run debug-build
Then, open a web browser and navigate to localhost:3000. Please note that the default port is 3000 but you can run this application in another port by setting 'port' environment variable.
Below are some sample screenshots from SBGNViz.js sample application, illustrating some of its capabilities. Please click on a figure to see it in full size.
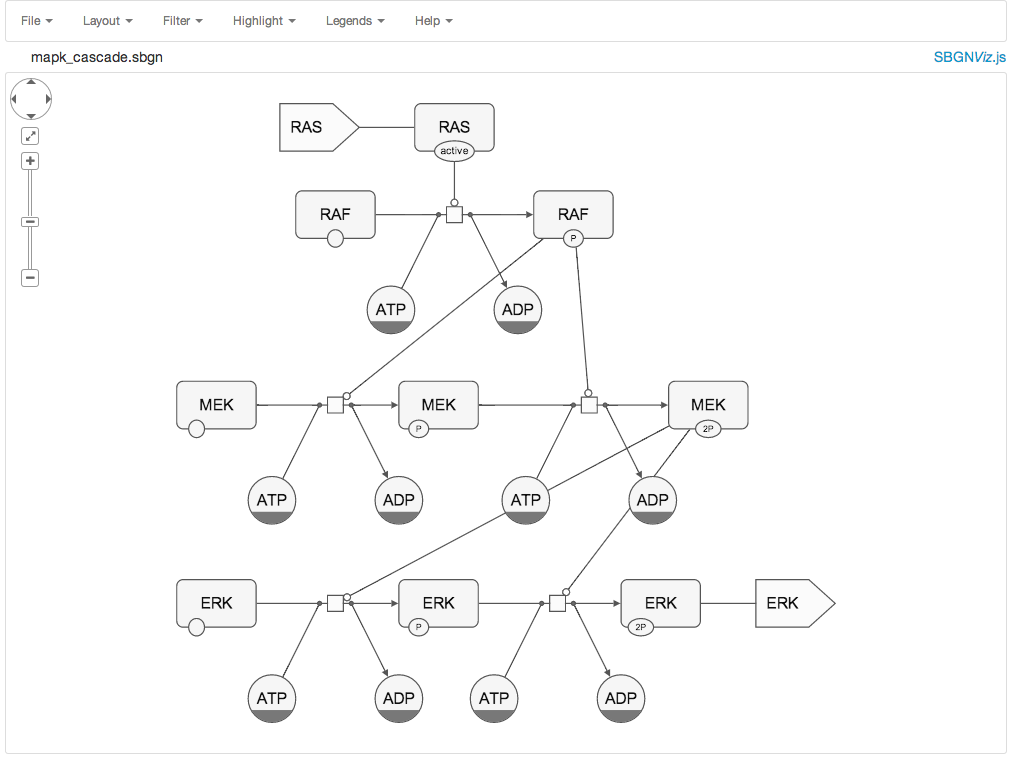
Mapk cascade pathway visualized in SBGNViz.js |
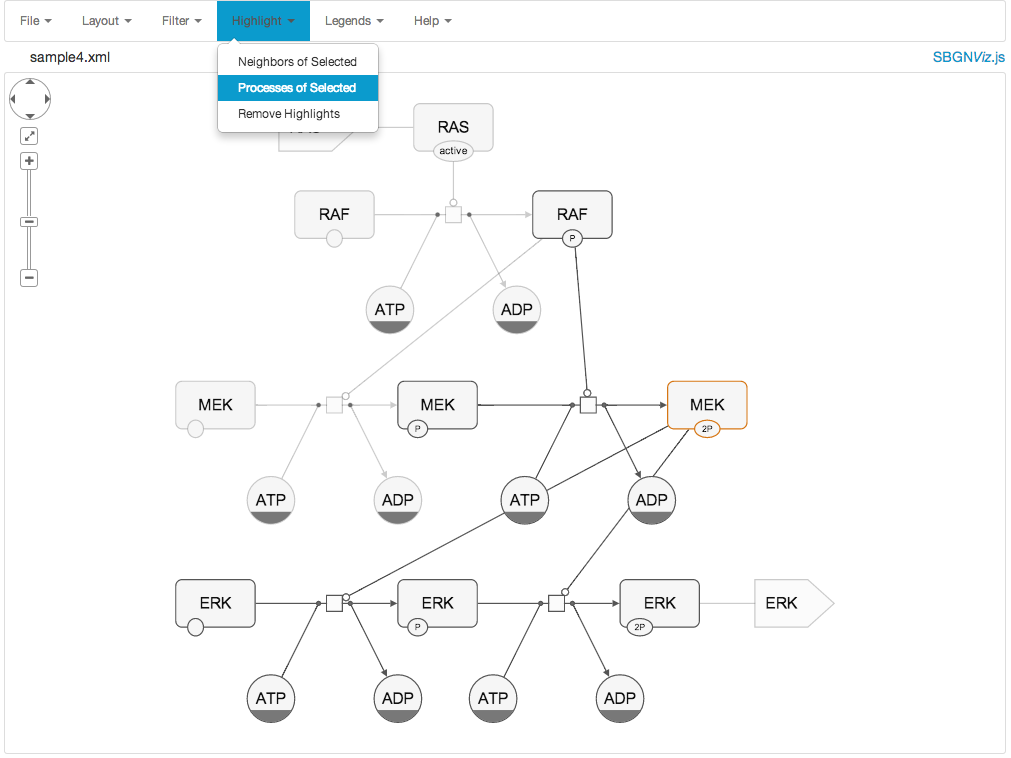
Highlighting processes of selected node group |
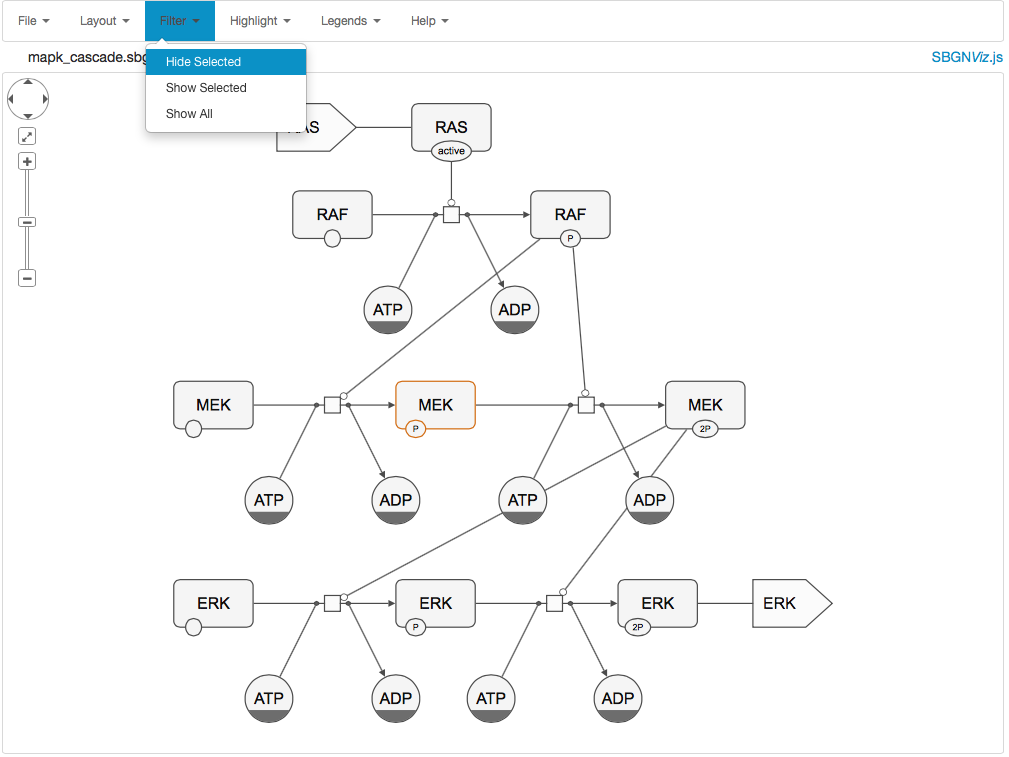
Hiding selected node group |
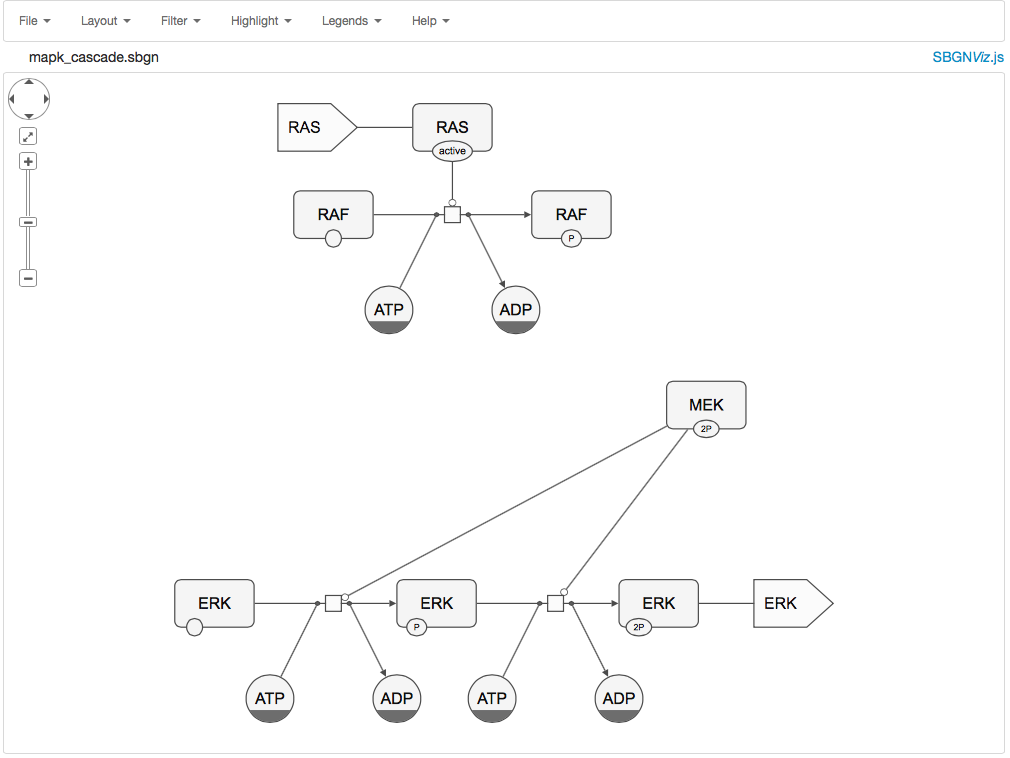
Same graph after applying hiding on selected node group |
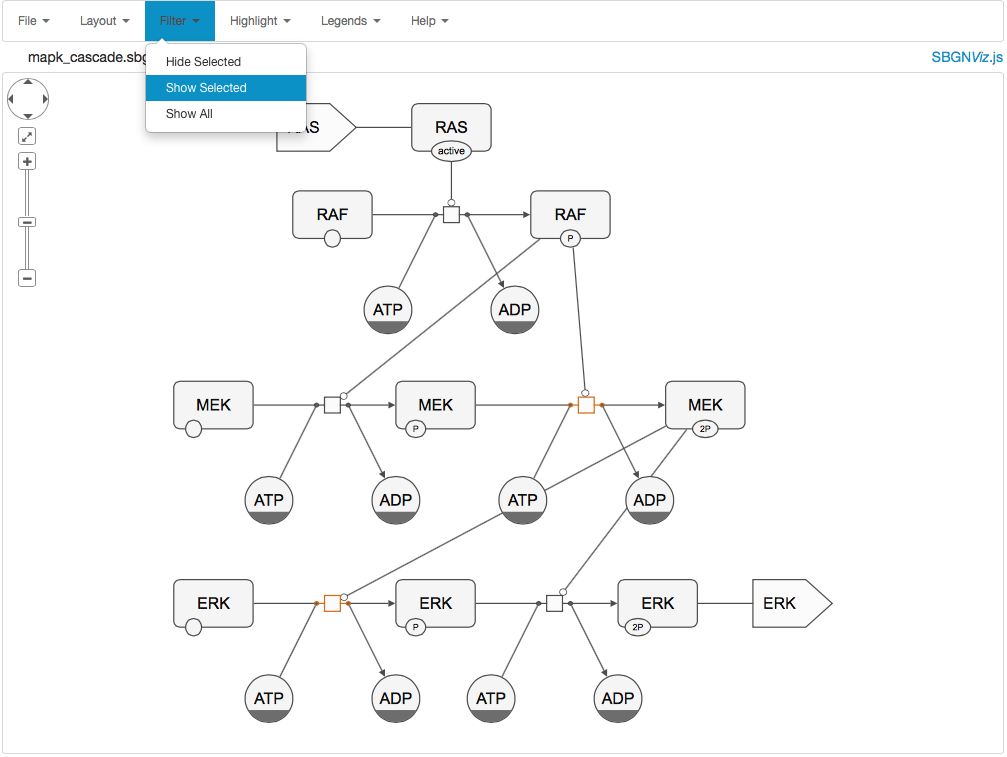
Showing only selected node group |
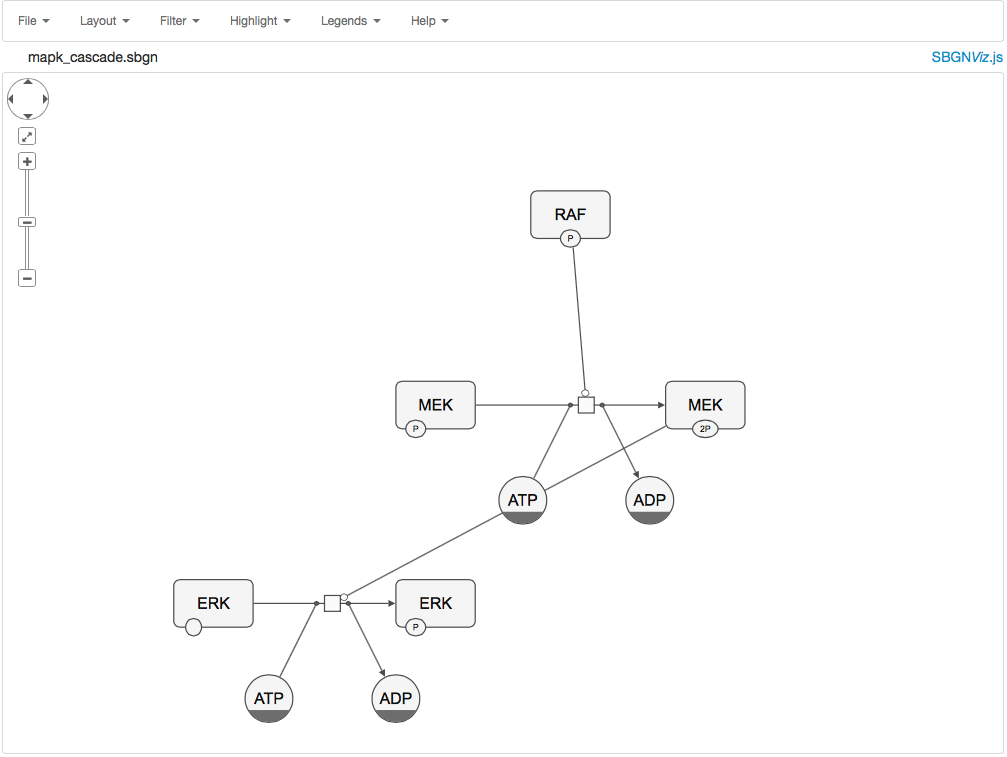
Same graph after showing only selected node group |
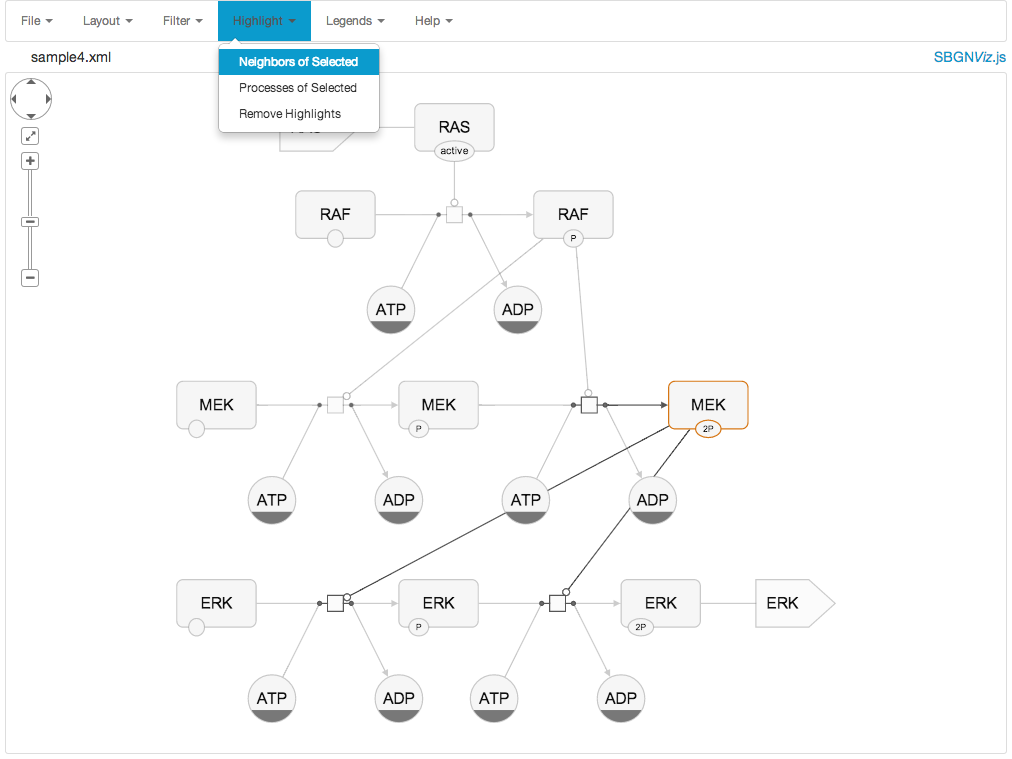
Highlighting neighbors of selected node group |
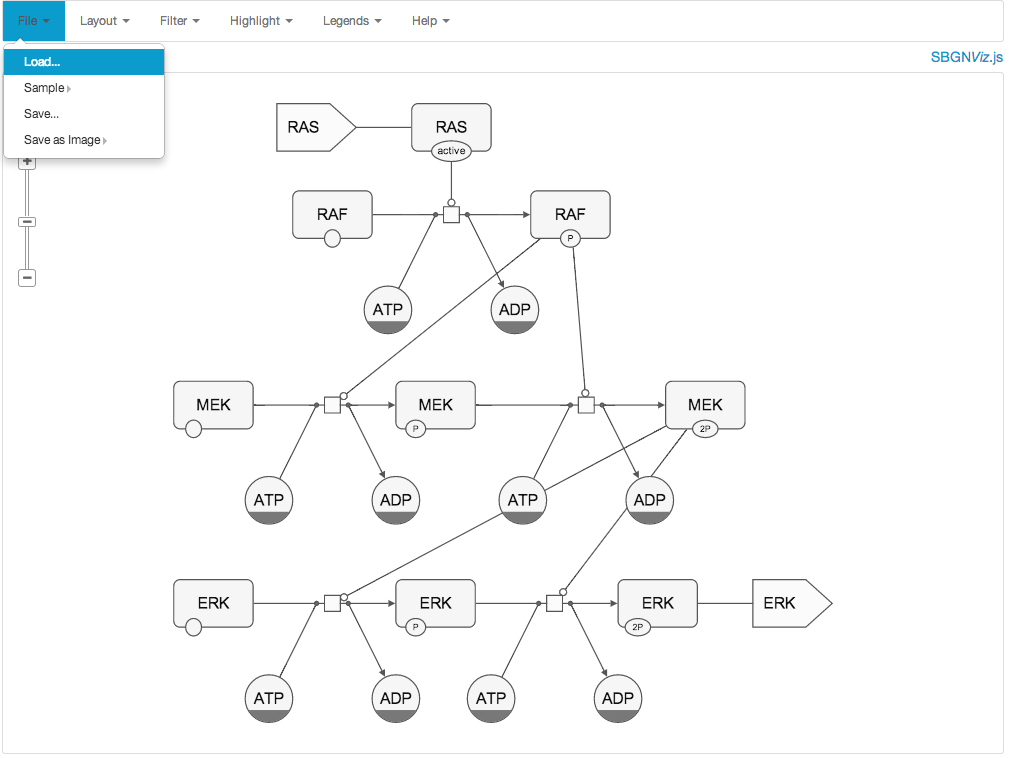
Load SBGN-PD diagram from an sbgn-ml file |
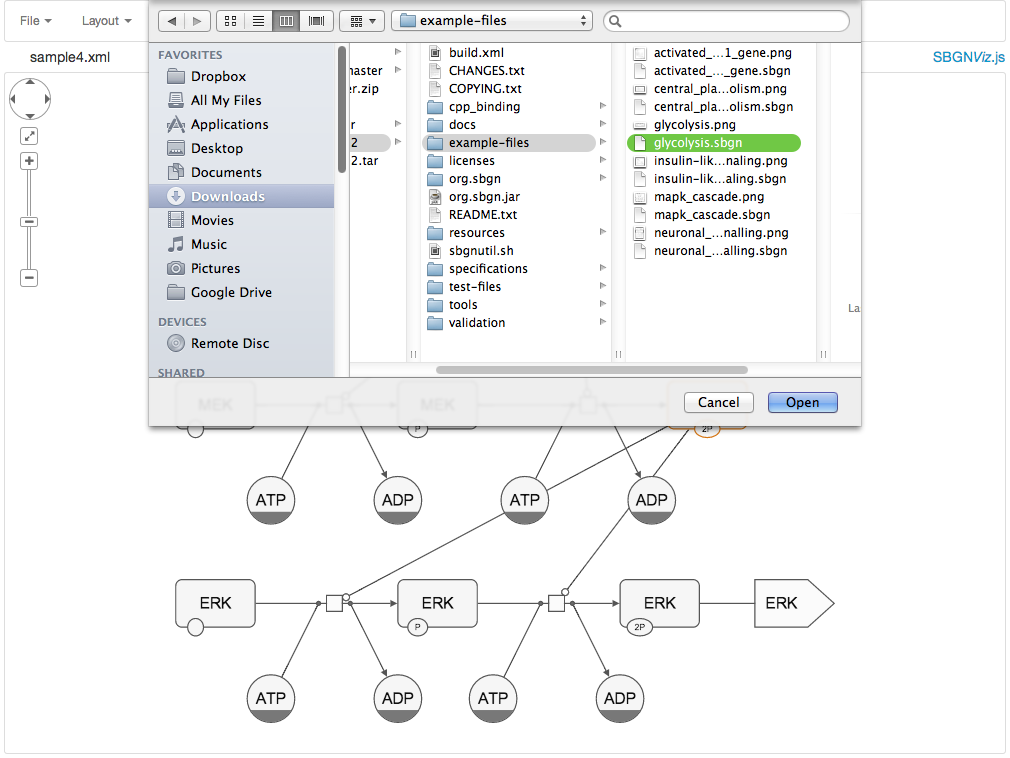
Loading an sbgnml file from file explorer |
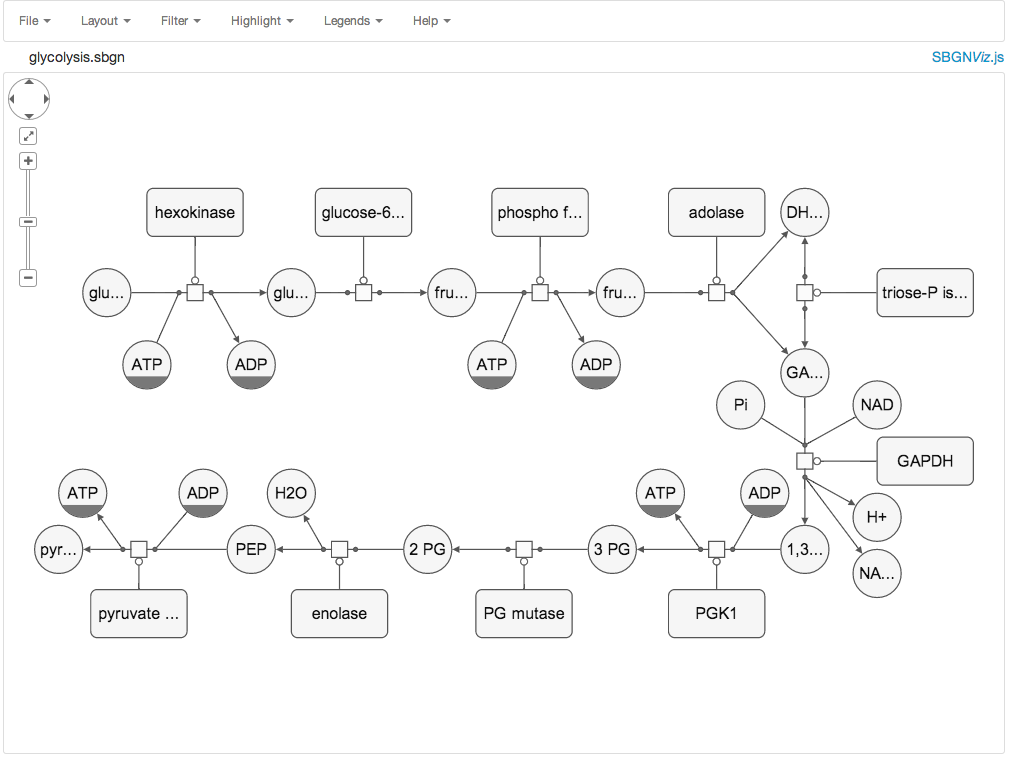
SBGN diagram visualization of Glycolysis after loading its sbgnml file |
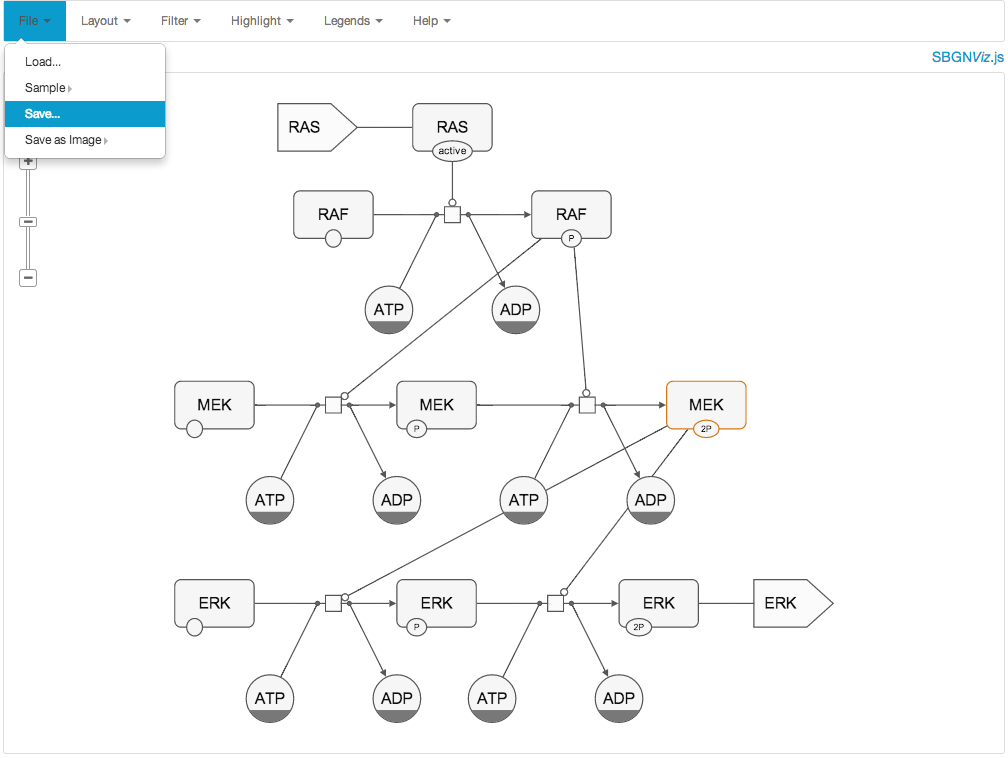
Saving current SBGN process description diagram as an sbgnml file |
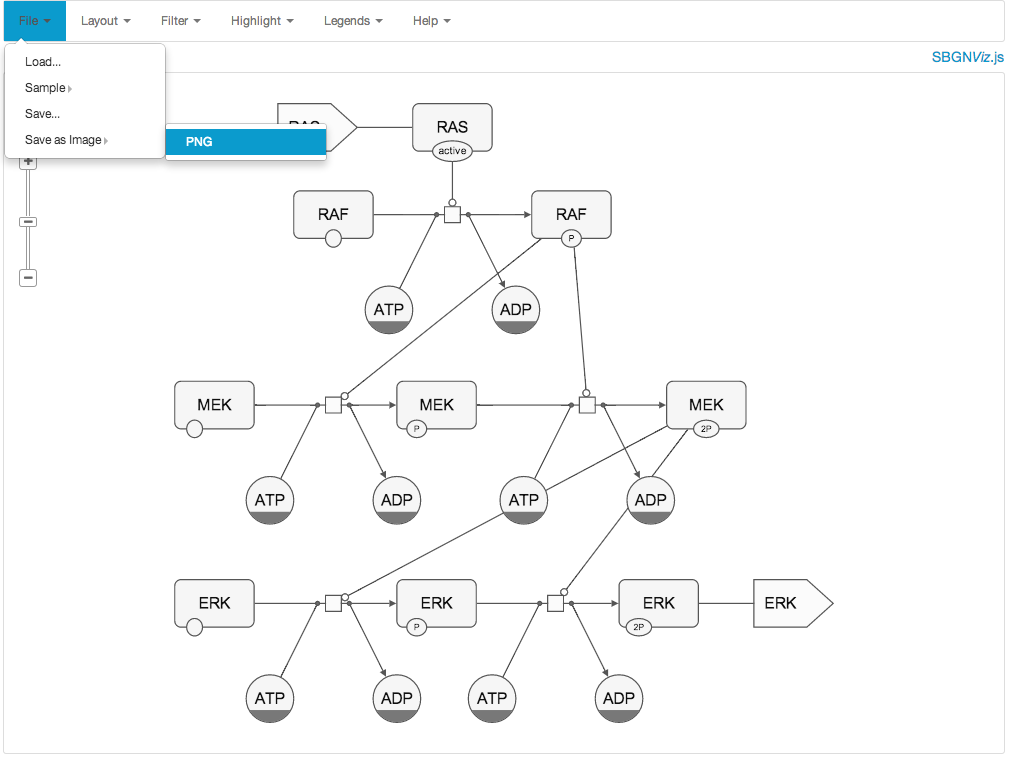
Saving current SBGN process description diagram as a png file |
Icons made by Freepik, Daniel Bruce, TutsPlus, Robin Kylander, Catalin Fertu, Yannick, Icon Works, Flaticon and licensed with Creative Commons BY 3.0
Thanks to JetBrains for an Open Source License