
Name: grafana
Owner: Clever
Description: Gorgeous metric viz, dashboards & editors for Graphite, InfluxDB & OpenTSDB
Created: 2016-05-05 20:03:15.0
Updated: 2016-05-05 20:03:19.0
Pushed: 2016-05-05 14:17:41.0
Homepage: http://grafana.org
Size: 133621
Language: Go
GitHub Committers
| User | Most Recent Commit | # Commits |
|---|
Other Committers
| User | Most Recent Commit | # Commits |
|---|

Website |
Twitter |
IRC |
Slack |
Email
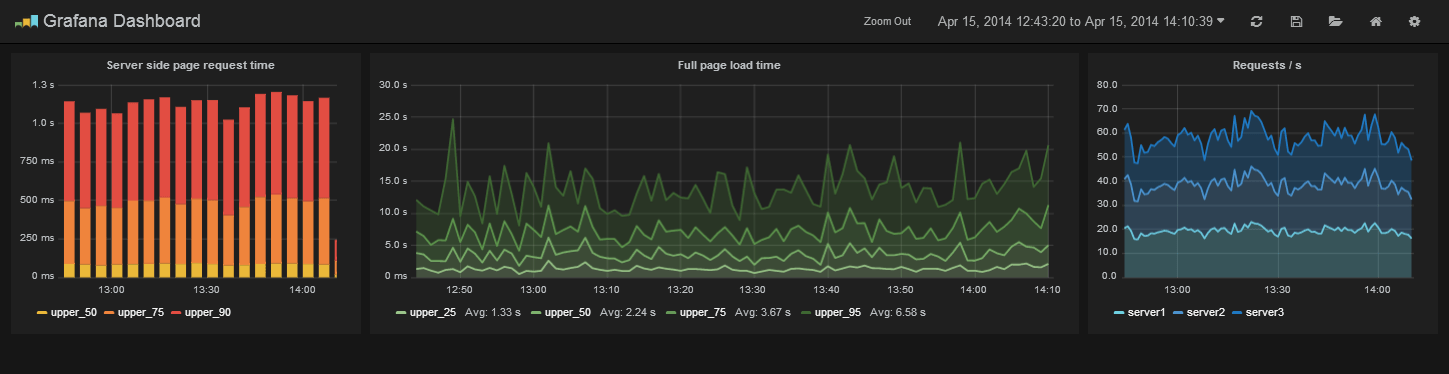
Grafana is an open source, feature rich metrics dashboard and graph editor for Graphite, Elasticsearch, OpenTSDB, Prometheus and InfluxDB.
There are no dependencies except an external time series data store. For dashboards and user accounts Grafana can use an embedded database (sqlite3) or you can use an external SQL data base like MySQL or Postgres.
Head to grafana.org and download the latest release.
If you have any problems please read the troubleshooting guide.
Be sure to read the getting started guide and the other feature guides.
If you want to build a package yourself, or contribute. Here is a guide for how to do that. You can always find the latest master builds here
et github.com/grafana/grafana
GOPATH/src/github.com/grafana/grafana
un build.go setup            (only needed once to install godep)
p restore                    (will pull down all golang lib dependencies in your current GOPATH)
un build.go build
To build less to css for the frontend you will need a recent version of of node (v0.12.0), npm (v2.5.0) and grunt (v0.4.5). Run the following:
install
run build
To rebuild on source change (requires that you executed godep restore)
et github.com/Unknwon/bra
run
n/grafana-server
Open grafana in your browser (default http://localhost:3000) and login with admin user (default user/pass = admin/admin).
Create a custom.ini in the conf directory to override default configuration options. You only need to add the options you want to override. Config files are applied in the order of:
Before or after you create a pull request, sign the contributor license agreement.
If you have any idea for an improvement or found a bug do not hesitate to open an issue. And if you have time clone this repo and submit a pull request and help me make Grafana the kickass metrics & devops dashboard we all dream about!
Before creating a pull request be sure that “grunt test” runs without any style or unit test errors, also please sign the CLA
Grafana is distributed under Apache 2.0 License. Work in progress Grafana 2.0 (with included Grafana backend)